Using R to Bum You Out Man
I read somewhere once that life seems to accelerate and feel shorter as you get older. That each subsequent year feels faster than the one before. So if you are 40, your 41st year feels a lot shorter than your 40th year. Someone commented (quite intelligently) that as a mathematical function, each year you get older accounts for a larger percentage of your remaining life expectancy than the one before.

So I thought, why not make a graph in R about that?
# set parameters for current age and current sex
curr.age <- 40
curr.sex <- "M" #enter "M" for male and "F" for female

# read in the social security mortality tables and find current life expectancy
content <- read_html("https://www.ssa.gov/oact/STATS/table4c6.html")
tables <- content %>% html_table(header = T, trim = T)
tables2 <- tables[[1]][-1,]
life.exp <- ifelse(curr.sex == "M", as.numeric(tables2[,4][tables2[,1]==curr.age]), as.numeric(tables2[,7][tables2[,1]==curr.age]))

future.age <- seq(curr.age, curr.age + life.exp)
remaining.years <- round(1/seq(life.exp,0)*100,2)
remaining.years <- unlist(lapply(remaining.years, function(x)(min(x, 100))))

plot.data <- data.frame("Age" = future.age, "Remaining.Years"= remaining.years)

p <- ggplot(data=plot.data, aes(x=Age, y=Remaining.Years)) + geom_bar(stat="identity", fill="steelblue") + geom_text(aes(label=Remaining.Years), vjust=-0.25, color="black", size=2.5) + ggtitle("Percentage of Remaining Life Expectancy For Future Birthday Year", subtitle = "https://jstoetz.github.io") + ylab("Percent for Each Year (%)") + theme_minimal()

ggsave(filename = "remaining-years.png", plot = p, device = "png", path = "/Users/jake_macbook_pro/Dropbox/jstoetz.github.io/jstoetz.github.io/assets/img/", height = 8.5, width = 8.5*2, units = "in")
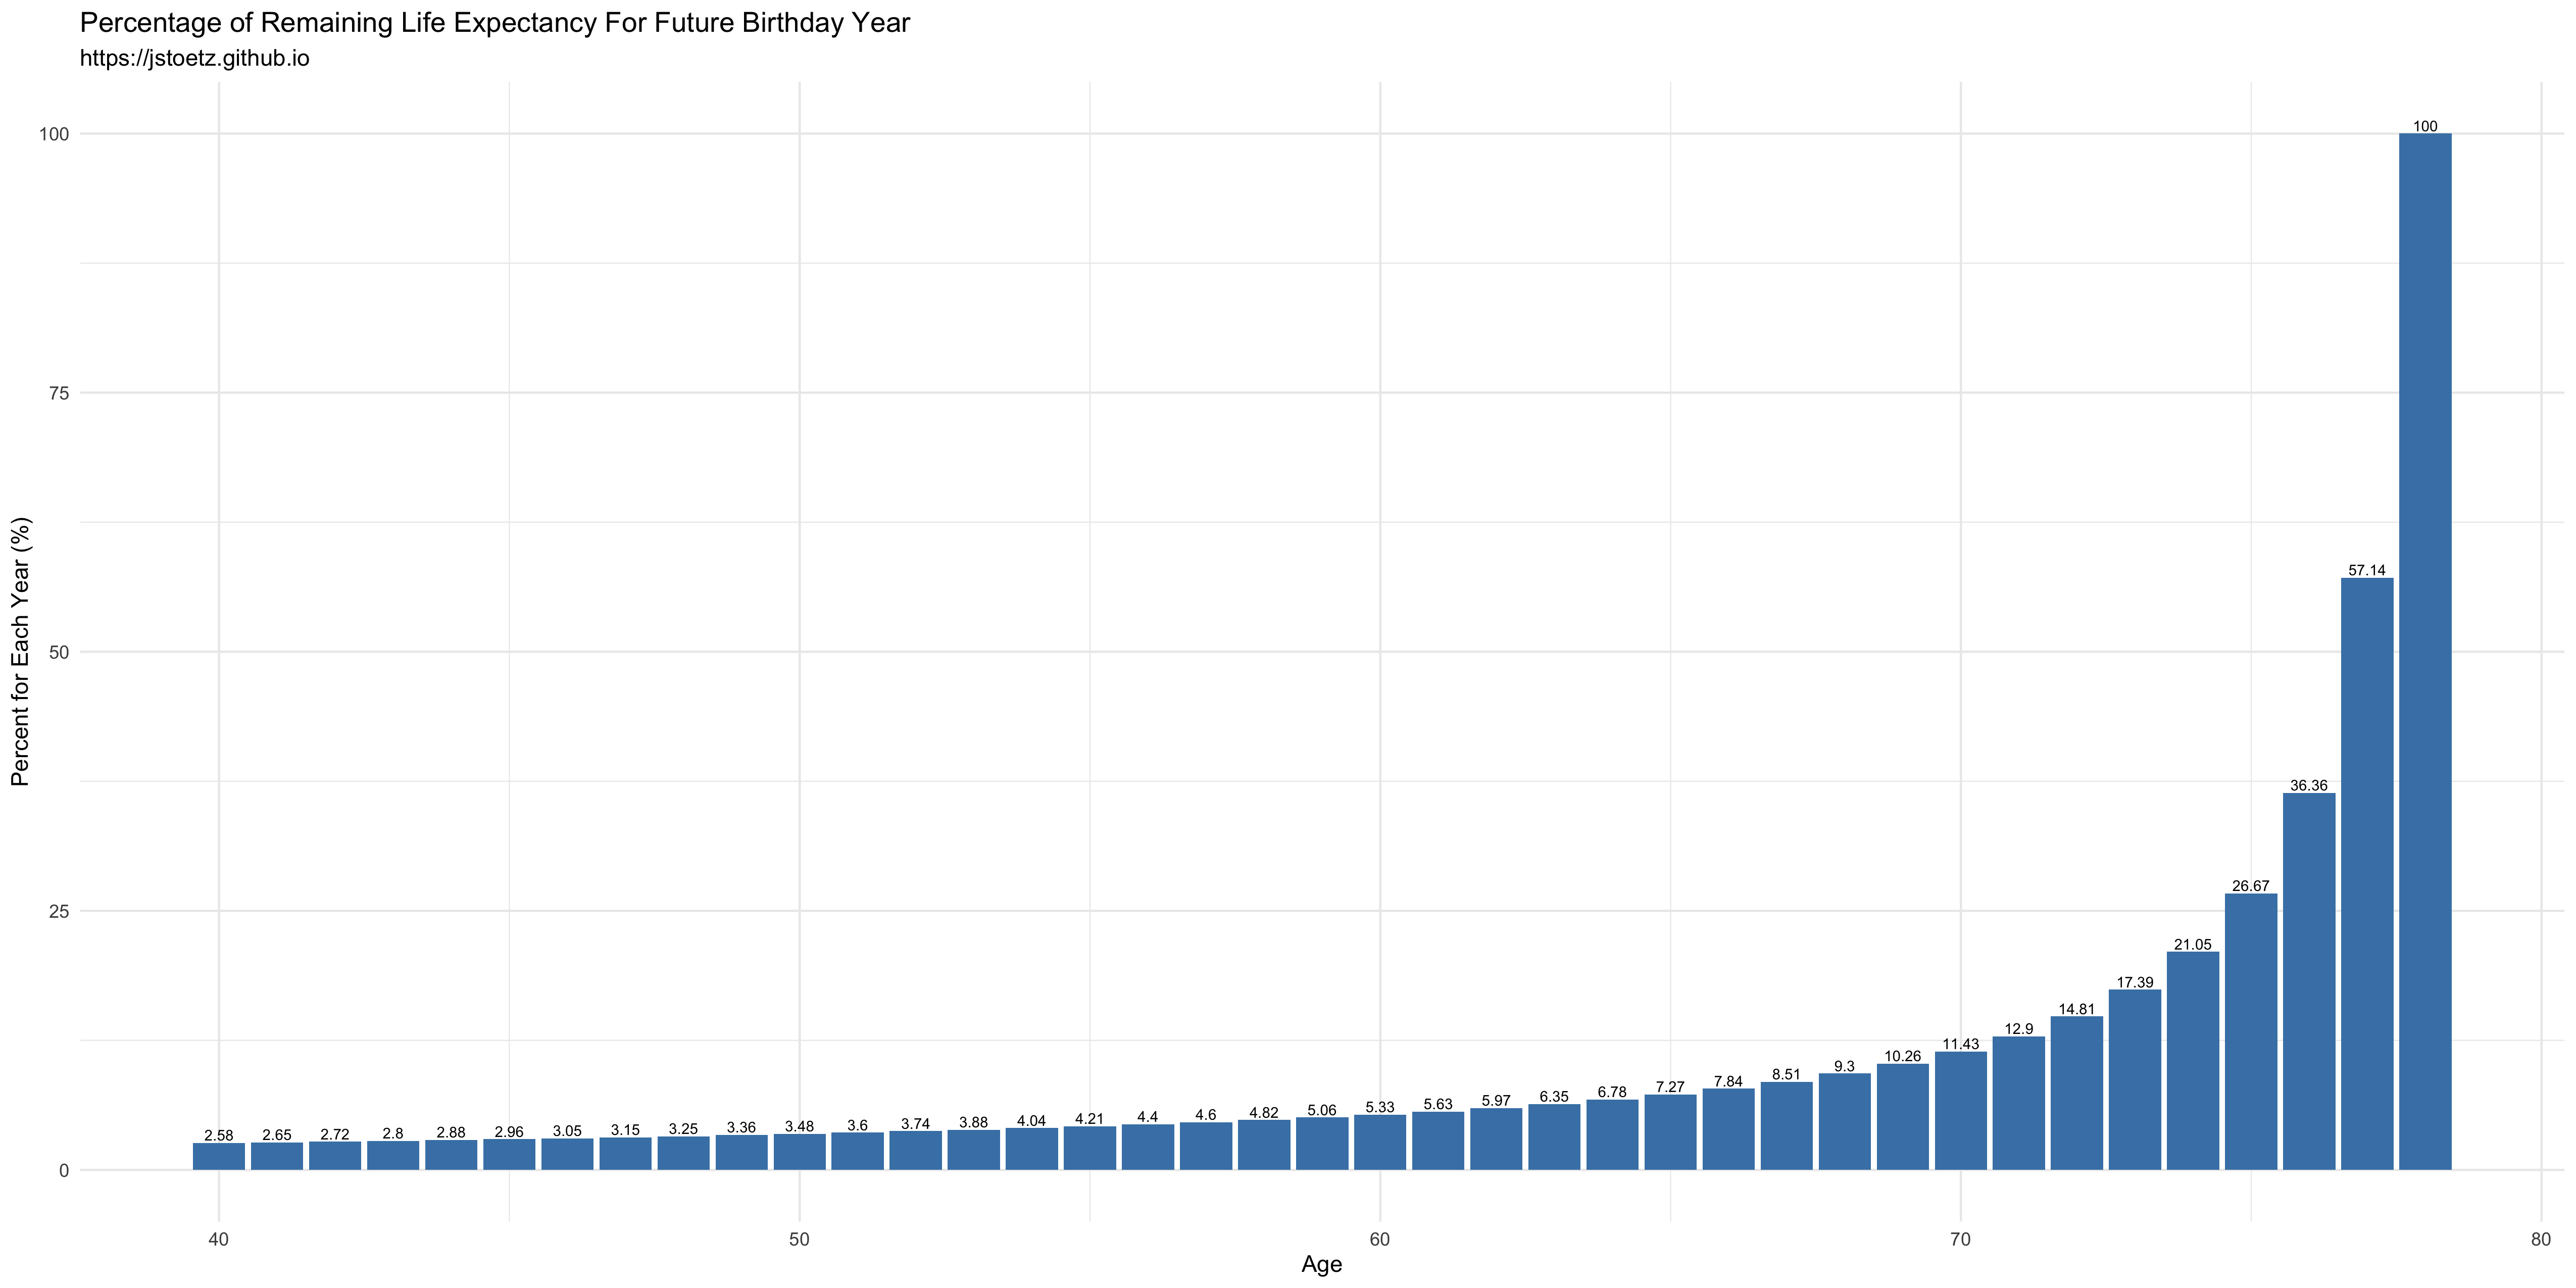
To read the chart, when our 40-year-old turns 50, that year will count for 3.48% of his remaining life expectancy. We assume he will die at 78.75, meaning he has 28.75 years remaining at age 50. 1/28.75 is approximately 3.48%. You can see the parabolic shape of the graph; it shows you accelarate into your remaining years. Sobering reality but mathematical proof that each year is more valuable than the one before!