Links for the Week of 2022-09-16
Here are some links I enjoyed from the past week.
Table of Contents
- Linear Regression for Stock Price Prediction in Python
- Multiple Regression for Stock Price Prediction in R
- Sleep and Melatonin
- More Top 1001 Albums
- Dashboards, Gamification and Algorithms for ToDo Lists
Linear Regression for Stock Price Prediction in Python
[ARTICLE] Predicting Stock Prices with Linear Regression in Python
A very well written article on using linear regression in python to predict stock price action.
The steps can be outlined as follows:
Step 1: Load the data
See 3 Easy Ways to Get Financial Data in Python for Stock Analysis - αlphαrithms - Link - DB.
Step 2: Prepare the data
Check for autocorrelation. See Autocorrelation of Time Series Data in Python - αlphαrithms - Link - DB.
Check to see if the variables are independent meaning that the “residuals (difference between the predicted value and observed value) for any single variable aren’t related.” This can be an issue with time series data because, by its nature time series data is “observed values for the same thing, recorded in sequence. This produces a characteristic called autocorrelation which describes how a variable is somehow related to itself (self-related.)”
Step 3: Use a technical indicator rather than the date as the independent variable
The author chooses a 10-day exponential moving average (EMA) via the ‘pandas_ta’ import.
Drop all ‘NA’ values caused by the technical indicator.
Step 4: Train-Test Split with 80/20 ratio
See Reshaping Data for Linear Regression With Pandas, NumPy, and Scikit-Learn - αlphαrithms - Link - DB
Step 5: Train the Linear Model
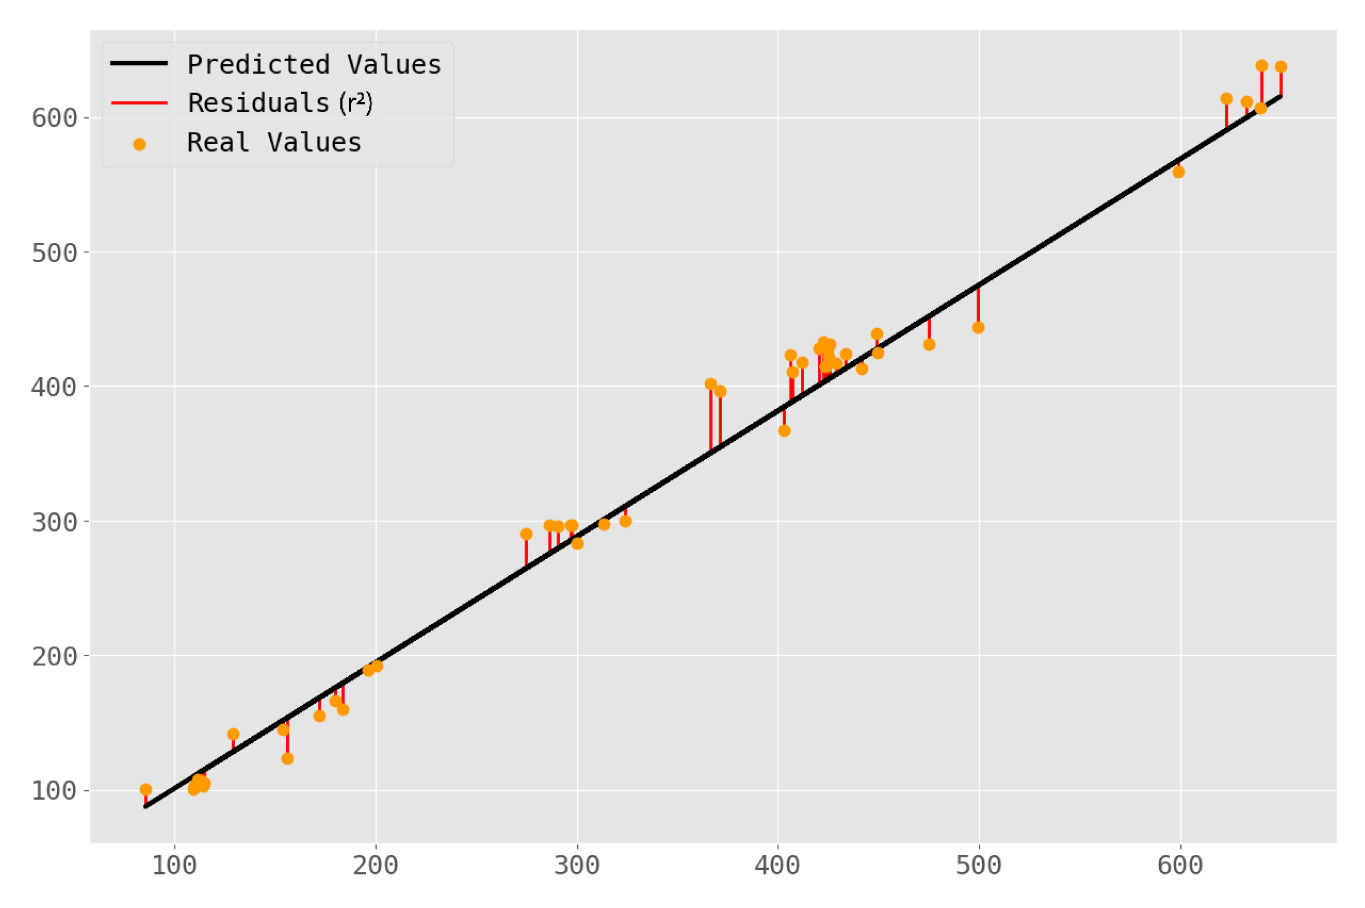
Step 6: Evaluate the Model
Potential metrics to evaluate the model include:
- model coefficients
- mean absolute error (MAE) - sum of the absolute error for all observed values divided by the total number of observations
- coefficient of determination (r2) - closer to 1 is better
Step 7: Interpret the model via Application of a Trading Strategy
This is where the author really shines - he makes the point that the model uses the 10-day EMA: “the EMA of any given day is and accurately predict that day’s closing price.”
As I have noted before, you have 3 options to chose for your entry when a model uses current day data
- Option 1: use the closing price of the current day as your entry, offset by a certain amount (ie, slippage in the wrong direction) because it is unlikely to get filled right at the close.
- Option 2: use the opening price for the following day as the entry since this is the next available data point.
- Option 3: assume that you can trade after-hours. This option is not available to most retail traders.
The author chose Option 2: “If our model predicts a higher closing value than the opening value we make a trade for a single share on that day—buying at market open and selling just before market close.”
Step 8: Apply the strategy to the test data and evaluate
The article concludes that the strategy made ~15% on 4 trades out of 49 days.
This would be a good time to run common trading statistics on the model, such as win percentage, drawdown etc.
TLDR: Linear regression in Python can be a useful tool in stock price prediction.
TODO: Work on implementing these steps into the financial time series models.
Multiple Regression for Stock Price Prediction in R
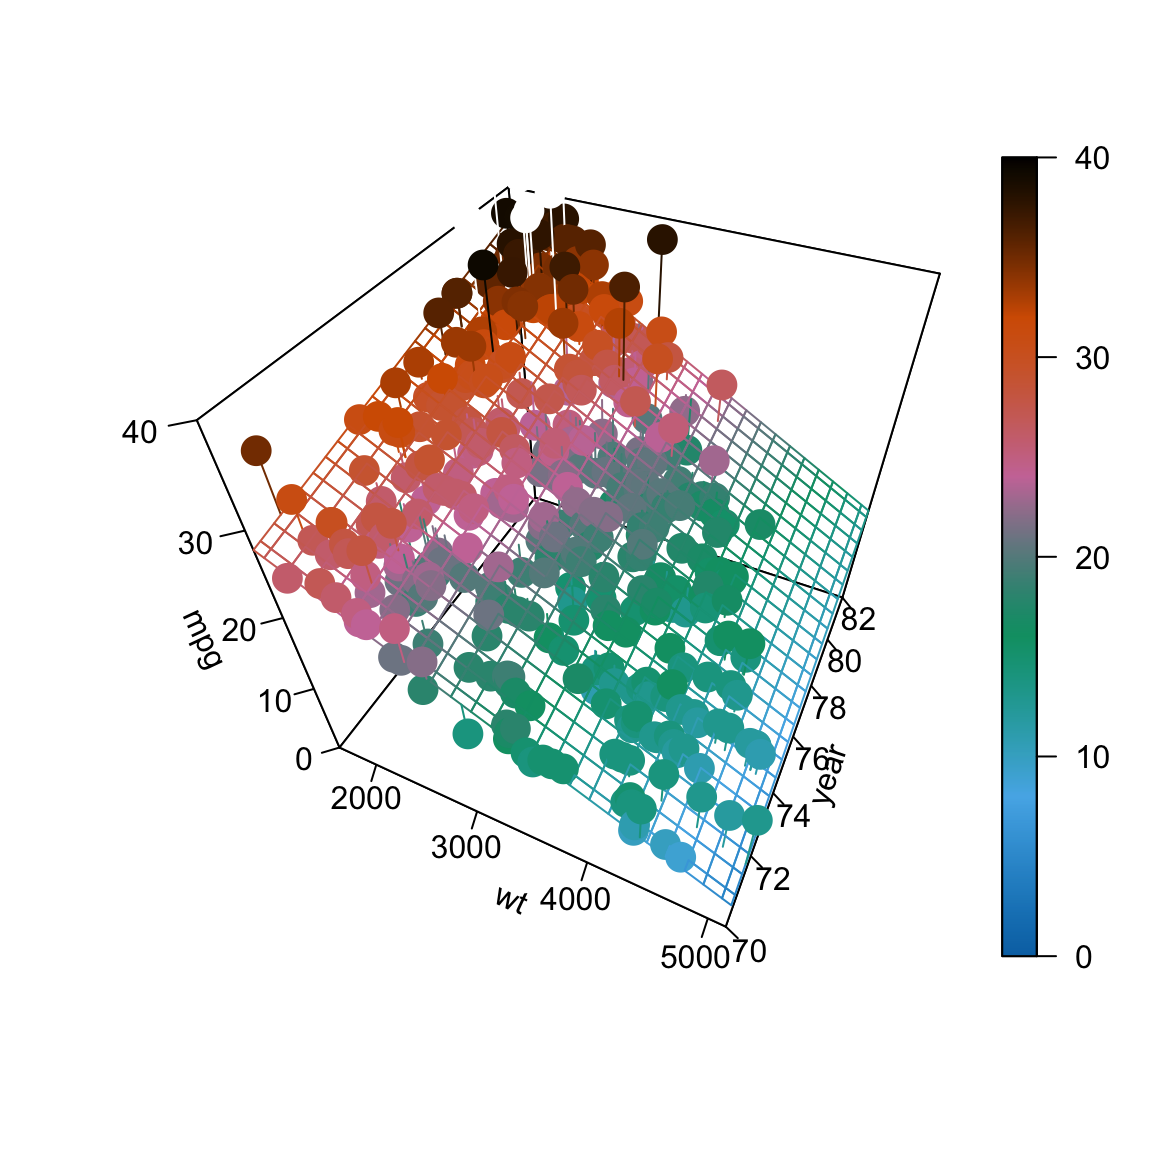
The image above is a 3-dimensional visualization of multiple linear regression using 2 predictor variables.
Instead of minimizing the distance between the response variable and a single predictor variable in simple linear regression, multiple regression seeks to fit more than one predictor variables to the response (or independent) variable.
This approach has 2 main advantages
- First datasets (and by extension, the “real” world) rarely have a single predictor variable. In the context of stock price prediction, multiple factors like volume, technical indicators derived from price and other instruments may influence future price action.
- Second response variables rarely if ever only depend on a single variable
[LIST] Resources for Linear Regression in R
- Modeling Basics in R - R for Statistical Learning - Link
- Multiple Linear Regression - Applied Statistics with R - Link. Note: this is from Chapter 9 of the book Applied Statistics with R - DB
- Regression in R - Link - DB
- Multiple linear regression made simple - Link - DB *
A Sample Workflow for Multiple Linear Regression of Stock Prices in R
Step 1: Identify the Stock(s) and Other Parameters
- Symbol
- Start Time
- End Time
- Period (daily, tick, 1-minute etc)
Step 2: Download the Data
Use a package to download the stock data
Step 3: Prepare the Data
- Remove any
NAvalues
Step 4: Add Technical or Other Indicators
Use the tq_mutate functions to add multiple technical indicators, such as ADX and EMA. See Link
Step 5: Scale or Standardize the Data
- Decide whether or not you should Scale the data.
- Scaling is generally appropriate when “variables of a data frame have different units.” See Link
- “[S]caling a variable means that it will compute the mean and the standard deviation of that variable. Then each value (so each row) of that variable is “scaled” by subtracting the mean and dividing by the standard deviation of that variable.” See Link
Step 6: Split the Data Between Train and Test
Usually use an 80 percent to 20 percent Train and Test split.
Step 7: Create and Train The Model
Step 8: Check for Conditions of Application of the Model
This Stats and R Article titled “Multiple linear regression made simple” does a brilliant job at breaking down this step and suggesting the performance package in R.
- Linearity - relationship of independent and dependent variable(s)
- Independence - observations should be independent of each other
- Normal Residuals
- Homoscedasticity - for the residuals
- No Outliers
- No multicollinearity - “Multicollinearity arises when there is a strong linear correlation between the independent variables, conditional on the other variables in the model.” See Link-,Conditions%20of%20application,remove%20some%20correlated%20independent%20variables%2C%20or%20eventually%20to%20standardize%20the%20data.,-You%20will%20often)
Step 9: Predict on Test Data
Step 10: Apply Trading Strategy
TLDR: A basic outline of how to run a multiple linear regression in R.
TODO: Upcoming blogpost on multiple linear regression on stock data..
Sleep and Melatonin

[ARTICLE] Can You Get Addicted to Melatonin? - The New York Times
An interesting article on the unknown effects of melatonin.
- How it works “Melatonin is a hormone produced primarily in a structure in the brain, called the pineal gland, that regulates the sleep-wake cycle. During the day, the gland does not create melatonin. After the sun sets, darkness triggers it to secrete the hormone, causing drowsiness and other signals that it’s time to sleep.”
- It’s non-addictive and you can’t become physically dependent on it, but it’s not for long-term use. “In general, experts consider melatonin to be safe for short-term use, say, a few nights per week for one to four weeks…”
- Opt for good sleep hygiene rather than melatonin
- Aim to wake up and go to bed around the same time each day, including on the weekends.
- Make sure your room is quiet and dark enough (a sleep mask can help block external light)
- avoid rigorous exercise for at least an hour and a half before bed, Dr. Rohr said. (Working out earlier in the day, however, can help you sleep.)
- limit your caffeine consumption throughout the day and avoid alcohol in the hours right before you go to sleep.
- Don’t use your phone before bed - instead try journaling.. “Since blue light suppresses your natural melatonin production, you should try to avoid screens for one to two hours before bedtime, Dr. Horvat said. “Your phone should not be in your bedroom,” she added. Instead, try journaling before bed, particularly if you are anxious about falling asleep. You can make a list of your worries, getting them down on paper instead of brooding over them.”
TLDR: Melatonin not best choice for quality sleep; no screens, regular wake/sleep time, limiting caffeine and alcohol, and a dark, cool room probably just as effective.
TODO: Maybe don’t take melatonin?.
More Top 1001 Albums

1001 Albums You Must Hear Before You Die (Complete Unofficial List)
I can’t get enough of the 1001 Albums To Hear Before You Die site. The UX and flow is ridiculously simple and complex. I have only listened to 4 albums, but the site keeps you motivated to keep grinding. If you want to see all of the albums in one place, use the link above. If you want to follow along with how poorly I am keeping up, you can check that out here.
TLDR: Listen to more music, party people.
TODO: Use the RVEST package and the complete 1001 album list.
Dashboards, Gamification and Algorithms for ToDo Lists

My Productivity/Daily Dashboard
[JOURNAL] Optimal To-Do List Gamification for Long Term Planning
A Reddit user shared a very impressive daily dashboard that they used for Todoist. He or she did us the favor of laying out the code extremely nicely in case you were wanting to do the same.
But it made me think about why you would want to do something like this. Do I need to have something this in-depth to be successful? Is it overkill or am I just missing the boat? Gameification of task lists and other areas of our life have been discussed ad nauseum. We are either measuring our lives in all the wrong ways or not doing enough to level up our life.
Like some things, maybe it is that we aren’t measuring the right things: “While inexact heuristics have been developed over time, there is still no tractable principled algorithm for deciding which of the many possible tasks one should tackle in any given day, month, week, or year.” See Link. Whatever the case, we are likely at a new frontier of how best to organize your life using AI. But I can’t decide what to do next.
TLDR: Gamify your tasks. Tackle with algorithms and dashboards. Repeat for best life.
TODO: I have no idea.
Have a good week.