Backtesting Triple Miss Stocks in R
Backtesting possible short positions by examining stocks that miss EPS and revenue estimates and lower forward guidance reveals that the behavior of these Triple Miss stocks offers a profitable opportunity over the short-term.
Goal
Bespoke Investment Group offers a stock screen feature that “allows users to run in-depth earnings report screens and easily filter more than 150,000 individual quarterly reports for US stocks since 2001.”
They also offer a report showing what they have termed an Earnings Triple Play - that is a stock that “beats consensus analyst EPS estimates, beats revenue estimates, and raises forward guidance.” The term has become so well known that none other than Investopedia have given Bespoke credit for it. These stocks are the best candidates for long-term buy opportunities.
But is the opposite also true? Does a stock that misses consensus analyst EPS estimates, misses revenue estimates and lowers forward guidance a terrible long-term buy opportunity and a possible short opportunity? We can refer to these stocks in this category as a Triple Miss.
The goal is to quantify whether a Triple Miss makes a good short opportunity starting the day after the announcement.
Get the Data
Extract the Stock Symbols and Dates of Each Triple Miss
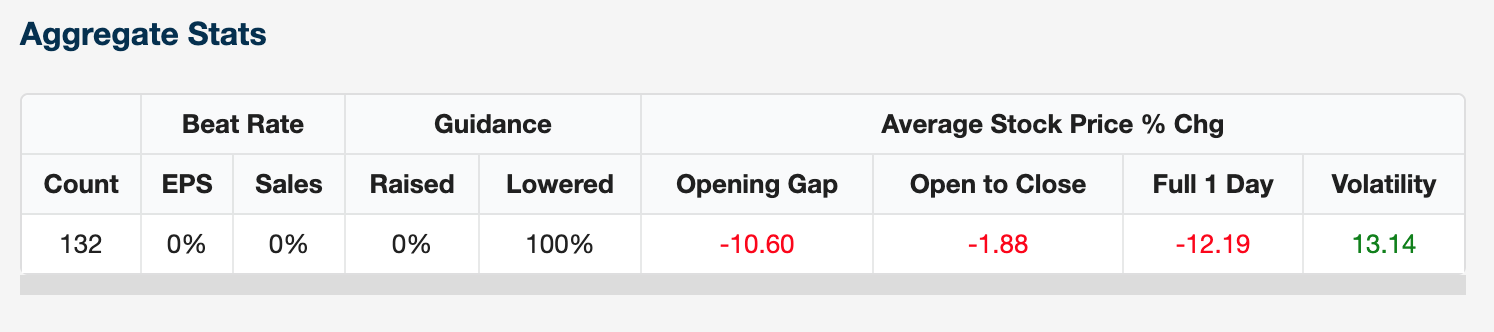
Using the aforementioned stock screener, I researched Triple Miss stocks in 2018, and downloaded a .csv file of the data. Turns out there were 132 Triple Miss instances (with 104 different stocks - some companies were listed more than once!) in 2018. On an aggregate basis, this was the return:
After reading in the data in R, I extracted the symbols and dates of each Triple Miss.
#create a list of symbols that can be read in
symbols <- unlist(temp$ticker)
ticker <- as.character(unlist(temp$ticker))

#get list of dates of triple miss dates
date <- as.Date(unlist(temp$date))
Once this was created, I tried to use the quantmod() package to look-up the historical data. quantmod() is wonderful for looking up individual stocks and analyzing them, but it is a challenge to deal with multiple stocks on varying dates of interest.
Get Historical Stock Data
Enter the batchgetsymbols() package.
As the creator of the package lamented:
In the past I have used function GetSymbols from the CRAN package quantmod in order to download end of day trade data for several stocks in the financial market. The problem in using GetSymbols is that it does not aggregate or clean the financial data for several tickers. In the usage of GetSymbols, each stock will have its own xts object with different column names and this makes it harder to store data from several tickers in a single dataframe. Package BatchGetSymbols is my solution to this problem. Based on a list of tickers and a time period, BatchGetSymbols will download price data from yahoo finance and organize it so that you don’t need to worry about cleaning it yourself.
The batchgetsymbols() package worked beautifully to download all of the historical data for each stock going back to 2018 and return it in one giant, clean dataframe.
#<-----TRIPLE MISS ANALYSIS ----->
#Batch download symbols - change type.return to "log" for log
l.out   <-  BatchGetSymbols(tickers   = ticker,
                         first.date   = start.data,
                         last.date    = end.data,
                         type.return  = "arit",
                         freq.data    = freq.data)

#get a list of tickers that were downloaded
all.ticker <- l.out$df.control$ticker
Filter Out Data Prior to Triple Miss
After getting the dataframe set-up, I used the dplyr() package to filter out data prior to the Triple Miss announcement. This was required because I only wanted to look at the performance of the stock after the date of the Triple Miss. I then created a new data frame to hold this data using the bind_rows() function.
#filter out all data before entry date by ticker
b <- mapply(function(a,b)(l.out$df.tickers %>% filter(ref.date > a, ticker == b)),date,ticker,SIMPLIFY = F)

#create new df without the post entry date data
b1 <- bind_rows(b)
summary(b1$ret.closing.prices)
Examine the Aggregate Stock Data
Interestingly, the average cumulative daily return for each stock measured from the date of the Triple Miss to the date of this post has been 4.28% - that means an average annual return of 1.36%. The average daily return is .005%. On an annualized basis, this is a Sharpe Ratio (return/volatility) of 0.59 - clearly a lot of volatility for not a whole lot of return!
b2 <- b1 %>%
  select(ref.date,ticker,ret.closing.prices) %>%
    group_by(ticker) %>%
      summarise(Mean_Daily_Return = mean(ret.closing.prices,na.rm = TRUE)*100, Cum_Daily_Return = sum(ret.closing.prices,na.rm = TRUE)*100) %>%         arrange(Cum_Daily_Return)

> mean(b2$Cum_Daily_Return)
[1] 4.281108
> mean(b2$Mean_Daily_Return)
[1] 0.00539823
> mean(b2$Mean_Daily_Return)/sd(b2$Mean_Daily_Return)*sqrt(252)
[1] 0.5942328
Examine the Aggregate Stock Data 1, 5 and 10 Days After Triple Miss
What if we shortened the window for analyzing the returns of all of the Triple Miss Stocks? Do the effects of the Triple Miss “wear off” at a certain point or do they continue?
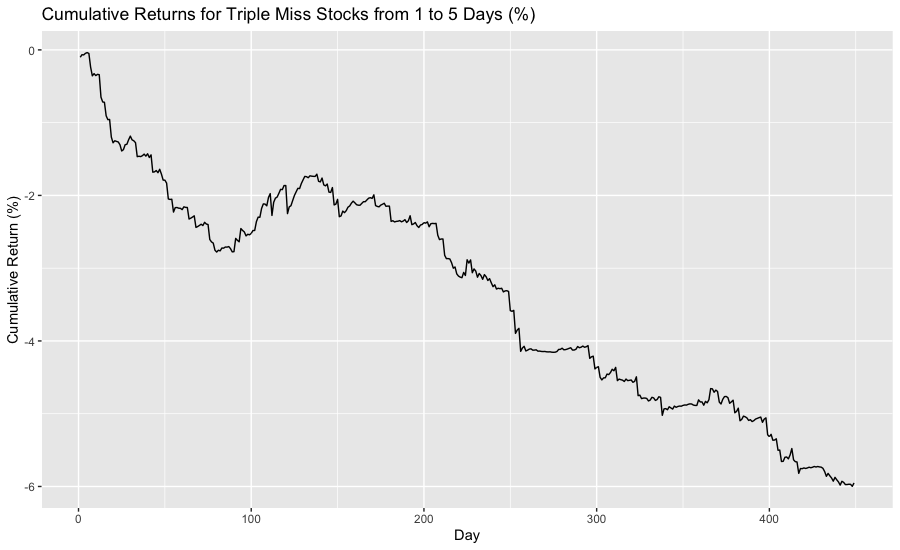
The Triple Miss stocks are very negative - below is a chart with the cumulative return from 1 to 10 days after each Triple Miss.
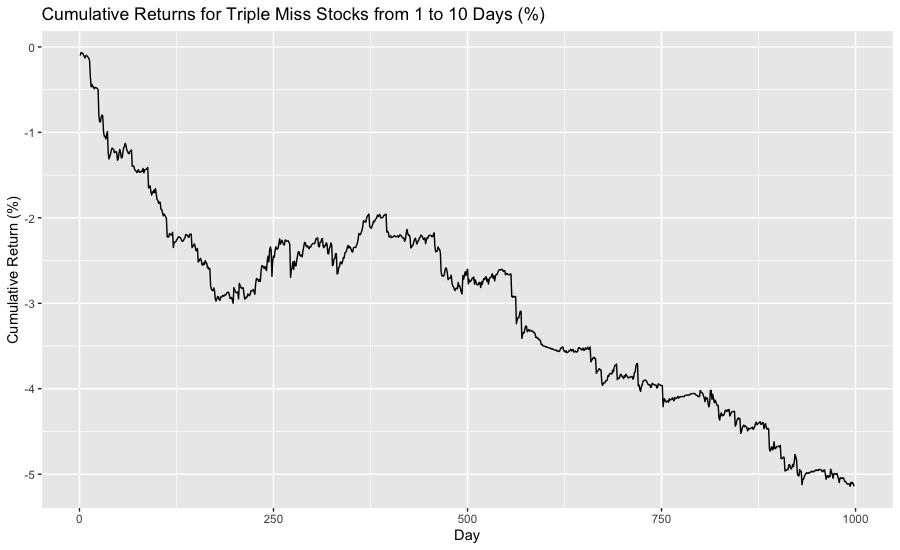
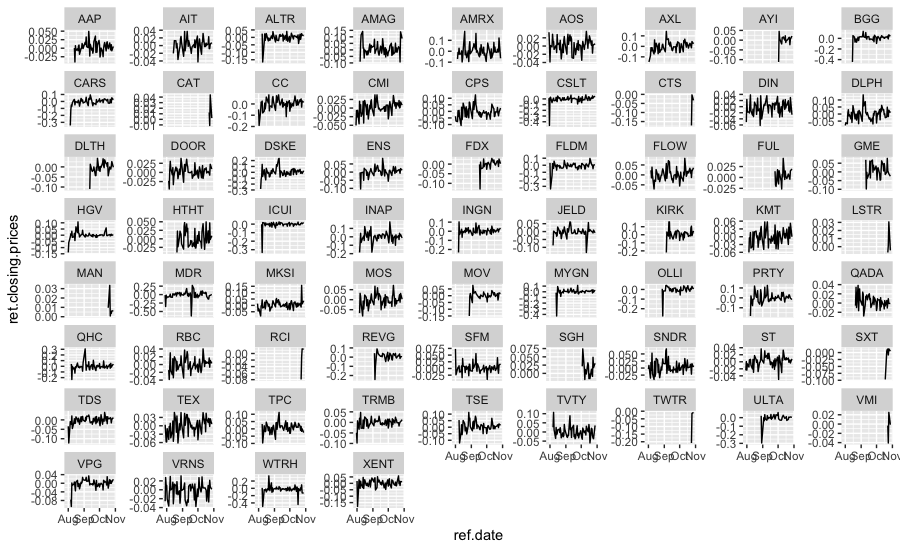
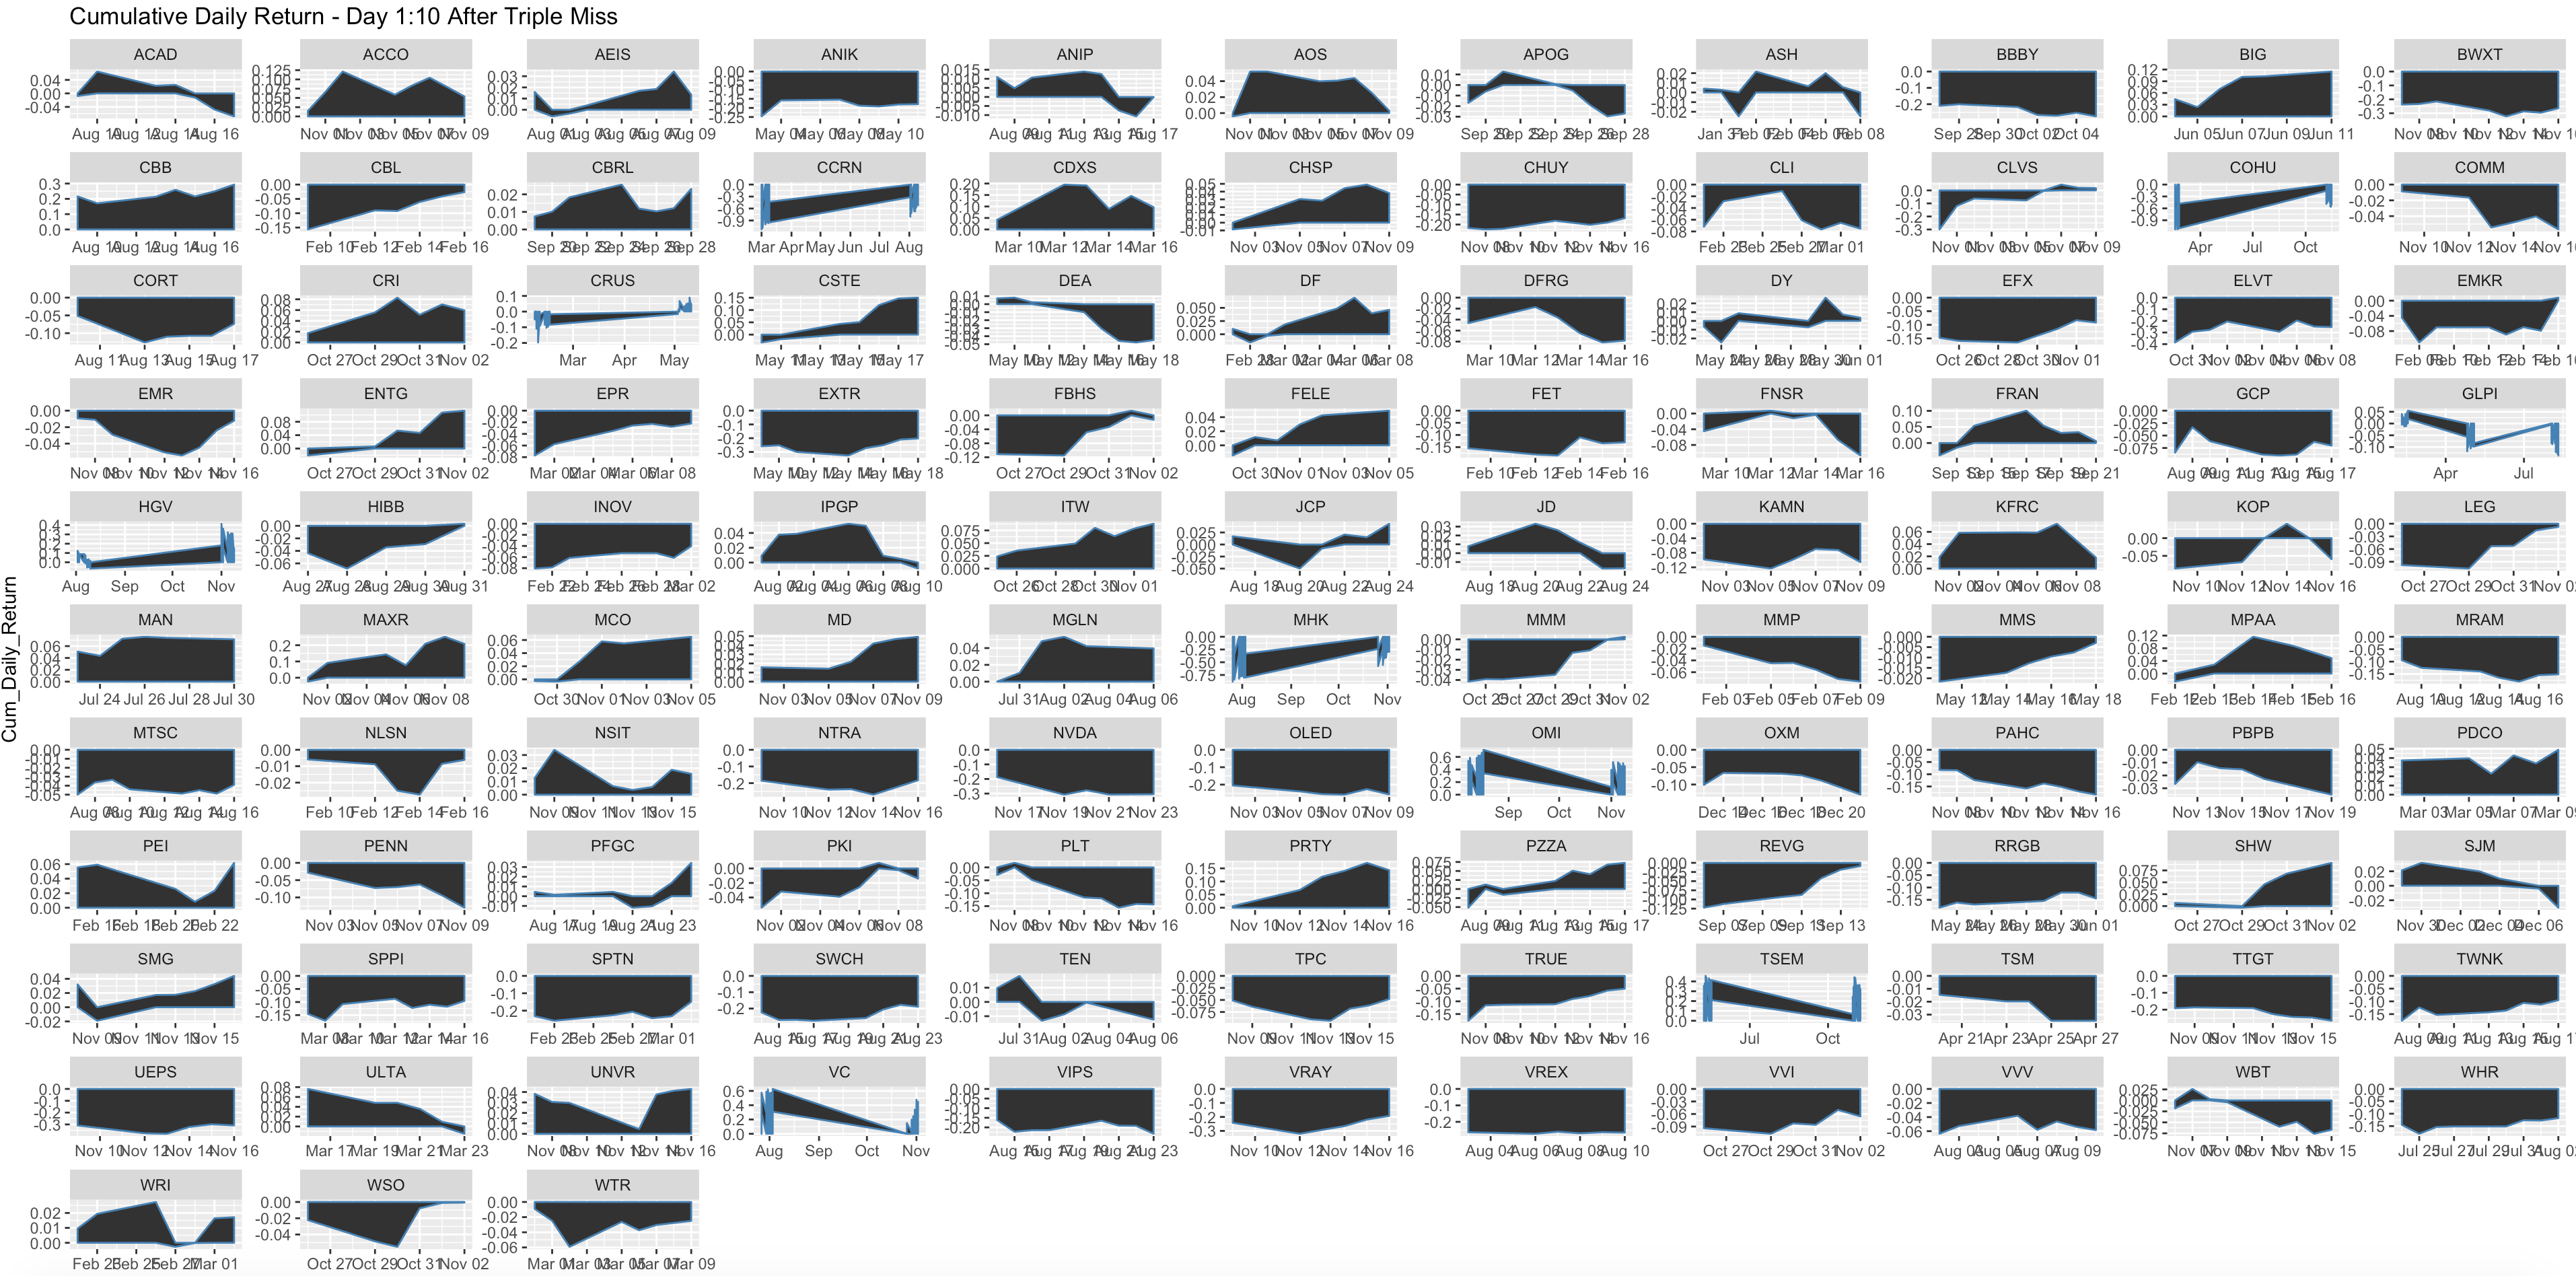
On an individual basis, you can see the downward trend each stock exhibits post-Triple Miss.
On an aggregate basis after 10 days:
- 71 out of the 113 stocks (approximately 63%) had a negative cumulative daily return 10 days after the Triple Miss,
- each stock had an average daily return of -0.58% and cumulatively lost 4.55% in value by day 10, and
- had an average Sharpe Ratio (average daily return divided by average standard deviation of the daily returns) of -5.57.
In short, the returns were less than spectacular.
Over 5 days, returns were even worse:
- 66 out of the 113 stocks (approximately 58%) had a negative cumulative daily return 5 days after the Triple Miss,
- each stock had an average daily return of -1.46% and cumulatively lost 5.26% in value by day 5, and
- had an average Sharpe Ratio of -6.50.
And the day after a Triple miss? 95 of 113 (84%) were down day-over-day by an average of 6.86% with a Sharpe Ratio of -10.62.
Conclusion
It seems clear that Triple Miss stocks would be a good place to start when looking for stocks to short over the near-term. Obviously, this is not a recommendation to buy or sell; you would need to do your own research and make your own decision to determine that. But the Triple Miss stocks might be a good filter to start looking for opportunities.
Notes & Research
- Analyzing Stocks Using R
- An Introduction to Stock Market Data Analysis with R (Part 1)
-
[getSymbols Extra R-bloggers](https://www.r-bloggers.com/getsymbols-extra/) - quantmod: examples :: data
- Different Ways to Obtain and Manipulate Stock Data In R Using quantmod – Programming For Finance
- Data Science: Theories, Models, Algorithms, and Analytics
- R Quantitative Analysis Package Integrations in tidyquant
- Tidy Portfoliomanagement in R
- Manipulating Time Series Data in R with xts & zoo
- chapter4.key
- Processing and Analyzing Financial Data with R
- Working with Time Series Data in R
- quantmod-vignette.pdf
- r - Using lapply on quantmod, get straight to xts object? - Stack Overflow
- Using BatchGetSymbols to download financial data for several tickers
-
[Easy multi-panel plots in R using facet_wrap() and facet_grid() from ggplot2 Technical Tidbits From Spatial Analysis & Data Science](http://zevross.com/blog/2019/04/02/easy-multi-panel-plots-in-r-using-facet_wrap-and-facet_grid-from-ggplot2/) - dplyr: How to Add Cumulative Sums by Groups Into a Data Frame? - Articles - STHDA
-
[Make Beautiful Tables with the Formattable Package R-bloggers](https://www.r-bloggers.com/make-beautiful-tables-with-the-formattable-package/) - ggplot2 barplots : Quick start guide - R software and data visualization - Easy Guides - Wiki - STHDA
-
[Make Beautiful Tables with the Formattable Package Displayr](https://www.displayr.com/formattable/)